Co-localization analyses of genomic features: Methods and potential pitfalls
Chakravarthi Kanduri(skanduri@ifi.uio.no), Christoph Bock(cbock@cemm.oeaw.ac.at), Sveinung Gundersen (sveinungu@ifi.uio.no), Eivind Hovig (ehovig@ifi.uio.no), Geir Kjetil Sandve(geirksa@ifi.uio.no)
(This page provides examples of the pitfalls related to co-localization analysis of genomic features. All the examples are provided through the Genomic HyperBrowser, which is tightly connected to the Galaxy framework. Users not familiar with Galaxy framework can quickly get familiar by following a quick introduction tutorial here (https://galaxyproject.org/tutorials/g101/).)
Example-1: Make sure that the genome coordinates are compatible in terms of genome build
Before performing any genome arithmetic operations on genomic track files, it would be essential to ensure the compatibility of genomic track files that are being jointly analyzed. One of such sanity checks should ensure the homogeneity of genome build. If genomic track files of different genome builds are integrated, it would lead to erroneous conclusions.

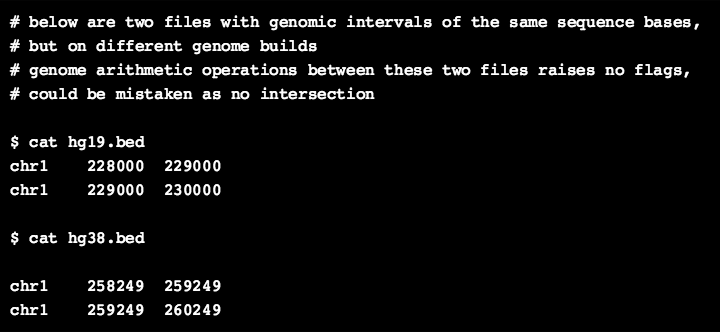
As an example, the element-1 in the galaxy history below is a small BED file containing only two genomic intervals on hg19 genome build, whereas the element-2 contains the same two genomic intervals but on hg38build. When we perform a simple intersection operation on both these files as shown in element-4, there is no overlap between these two files, even though they should in principle overlap 100%. However, when we lift over the coordinates of one of the track file to the other genome build, the real overlap of 100% (2kb here) is shown (element-5 in the history).
Example-2: Make sure that the genome coordinates are compatible in terms of genome coordinate system
Before performing any genome arithmetic operations on genomic track files, it would be essential to ensure the compatibility of genomic track files that are being jointly analyzed. One of such sanity checks should ensure that the genome coordinates are compatible in terms of the coordinate system being used.

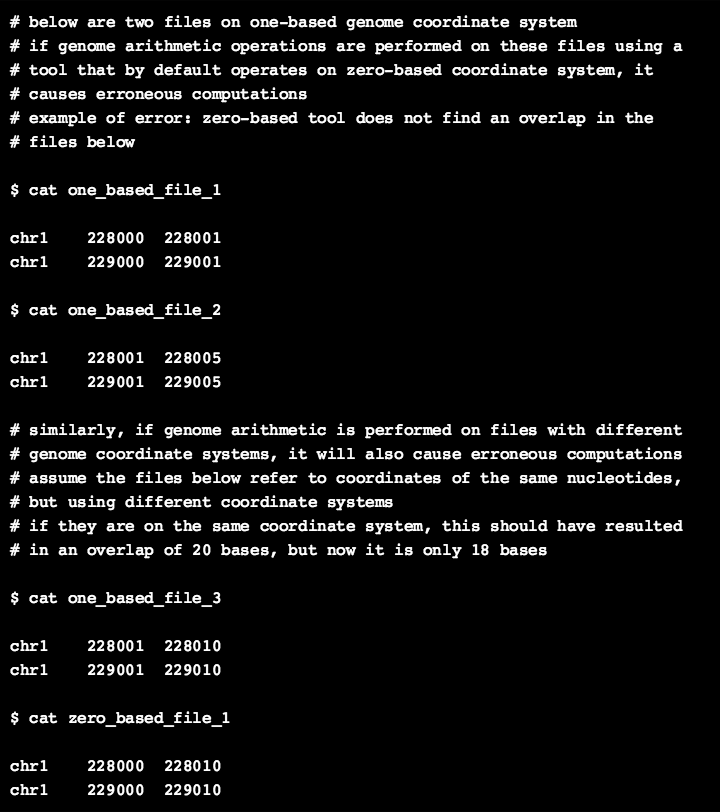
In the galaxy history below, assume that the files in history elements 1 and 2 are on a one-based coordinate system, which is end-inclusive. (BED files should not be one-based, but assume they are one-based genomic track files of any format). Both the files contain only two genomic intervals, and one can see that both the files overlap by one nucleotide base in each interval. However, if genome arithmetic operations are performed using a tool that by default operates on a zero-based coordinate system, they would not capture the intersection at the last base in each interval (because zero-based system is end-exclusive) as shown in history-element 5. The same problem would occur, if a one-based tool (such as Bioconductor’s GenomicRanges) is directly used on zero-based regions without conversion.
Second, if genome arithmetic operations are performed on files that are based on distinct coordinate systems, that would also lead to errors. As an example, let us assume that the history-elements 3 and 4 belong to different coordinate systems, but the genomic intervals they contain correspond to the same nucleotide bases. If both files are on the same coordinate system, there should have been a total of 20 bases overlap between both the files. However, operations on distinct coordinate systems resulted in the omission of one base each in each genomic interval, resulting in an overlap of 18 bases as shown in history-element 6.
Example-3: If reducing the size of genomic intervals, be conscious of the effects
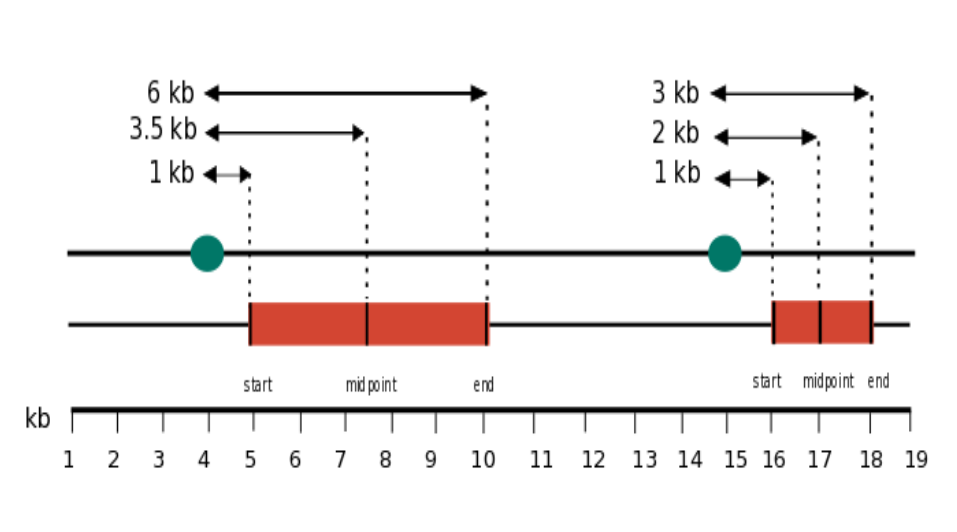
For certain questions, where measuring the distance between genomic elements is necessary, one of the genomic interval may be reduced to a single point (e.g., start or midpoint or end). However, because of the unequal sizes of the genomic elements (e.g., different sizes of genes), midpoint (or end) may not be an ideal choice in all cases.

As an example, in the galaxy history below, the element-1 contains the coordinates of some genes based on Ensembl annotation (hg19) and the element-2 contains the coordinates of the same genes, but expanded by 2kb upstream. Element-3 contains the distribution of distances from the 2 kb upstream intervals to the genic intervals in element-1. Here, we measured the distance to the start of the genic intervals in element-1. So, all the distances spanned 2 kb with no surprises. But, if we measure the distances to the midpoint, there is huge variance in the distances because of the unequal sizes of the genomic intervals (history-element 4). The average log-distance between each point in the upstream sequences track (element-2), and its nearest point in Ensembl genes track (element-1) is 7.6 when the distance is measured to the start, whereas it is 13.06 when measured to the midpoint (as shown in history elements 5 and 6).
Author
hb-superuser
Related Pages
All published pages
Published pages by hb-superuser
Rating
(0 ratings, 0.0 average)
Tags