Co-localization analyses of genomic features: Methods and potential pitfalls
Chakravarthi Kanduri(skanduri@ifi.uio.no), Christoph Bock(cbock@cemm.oeaw.ac.at), Sveinung Gundersen (sveinungu@ifi.uio.no), Eivind Hovig (ehovig@ifi.uio.no), Geir Kjetil Sandve(geirksa@ifi.uio.no)
(This page provides examples of the pitfalls related to co-localization analysis of genomic features. All the examples are provided through the Genomic HyperBrowser, which is tightly connected to the Galaxy framework. Users not familiar with Galaxy framework can quickly get familiar by following a quick introduction tutorial here (https://galaxyproject.org/tutorials/g101/).)
Example-4: Avoid analysis at a predefined resolution, if there is no good biological reason for it
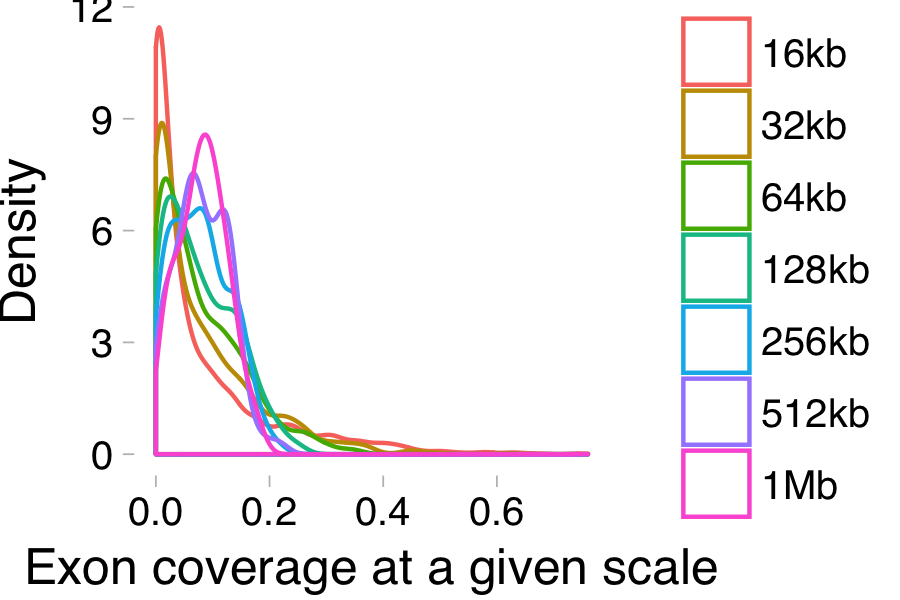
Biological processes appear differently when viewed at different scales. For instance, the plot below shows the distributions of exon coverage when measured at different resolutions (shown in the color legend).

In the galaxy history below, we observe the correlation between the exon coverage of genomic intervals and the GC content in human chromosome 22. For this, we separated the human chromosome 22 into bins of 1 kb size and 1 Mb size and measured their exon coverage and GC content (history elements 1-4). We then checked the correlation between these sequence properties using Pearson correlation coefficient. At 1 kb scale, the correlation between exon coverage and GC content is 24%, whereas at 1 Mb scale it is 58%.
Author
hb-superuser
Related Pages
All published pages
Published pages by hb-superuser
Rating
(0 ratings, 0.0 average)
Tags